Applying a data
visualization
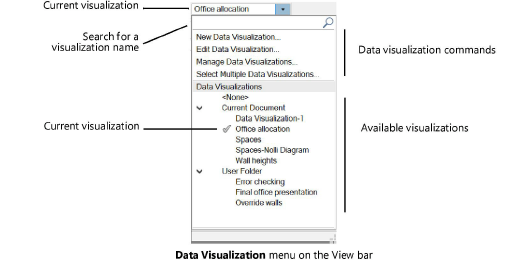
The Data Visualization menu
on the View bar lists the data visualizations in the current file as well
as in user and workgroup folders. The currently applied visualization
(or visualizations, if more than one is selected) displays with a check
mark.
From the View bar menu, select whether to display the menu
as Data Visualizations - Short (displays as an icon  )
or Data Visualizations - Long (displays the current visualization name).
In the long version of the View bar menu, when multiple data visualizations
are applied, the View bar displays <Multiple Data Visualizations>.
A data visualization of <None> indicates that objects are displayed
as defined by their attributes rather than by the settings in a data visualization.
)
or Data Visualizations - Long (displays the current visualization name).
In the long version of the View bar menu, when multiple data visualizations
are applied, the View bar displays <Multiple Data Visualizations>.
A data visualization of <None> indicates that objects are displayed
as defined by their attributes rather than by the settings in a data visualization.
The Data Visualization menu is only available
when a design layer is the active layer; on sheet layers, data visualizations
are applied as viewport properties.
To apply a data visualization to the drawing:
1. Click the Data
Visualization menu on the View bar.
2. Select the data visualization to apply.
If needed, enter some or all of the name of
a visualization in the search box; the list is automatically filtered
to display only items that match the search text.
Once selected, the visualization is applied
to the drawing; it is highlighted in the menu, and its name also displays
at the top of the menu (<Multiple Data Visualizations> displays
when more than one is applied). Switch to Top/Plan view to see the visualization.
Select <None> to display the drawing
with object attributes.
Applying
a data visualization to a viewport
Advanced viewport settings for Black and
White Only and Use layer colors do
not apply when a data visualization other than <None> is selected
for the viewport.
To apply a data visualization to a sheet layer viewport:
Do one of the following:
● For an existing, selected viewport,
select the visualization to apply from Data Visualization on
the Object Info palette.
● If the viewport has not yet been created,
select the data visualization from the View bar before creating the viewport.
The current data visualization automatically applies to the viewport.
A data visualization legend is automatically
added to the sheet layer.
Applying multiple data
visualizations
Command |
Path |
Select
Multiple Data Visualizations |
● View
bar
● Viewport Object Info palette
|
More than one data visualization can be applied at one time.
To apply multiple data visualizations to a design layer or
a selected viewport:
1. Do one of the following:
● For a design layer, click the Data
Visualization menu on the View bar, and then select the command.
● For a viewport, select the command
from Data Visualization on the Object Info palette.
The Select Multiple Data Visualizations dialog
box opens.
2. From the list of available data visualizations,
select the ones to apply.
Select data visualizations that do not
conflict with each other.
3. Click OK. The
data visualizations are applied to the drawing or to the viewport. In
the list of data visualizations on the View bar or from the viewport Object
Info palette, the selected visualizations display with a check mark.
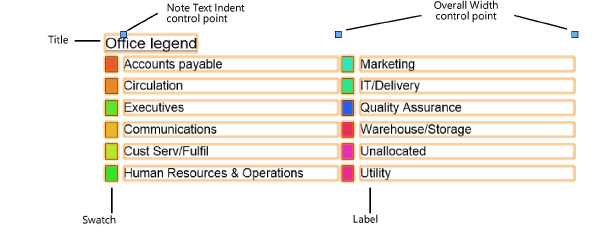
Data
visualization legends
When a data visualization is assigned to a sheet layer viewport,
a legend is automatically created within the annotation layer of the viewport.
To edit the legend properties:
1. Right-click on the viewport
and select Edit Annotations from the context
menu.
2. Select the legend to view and edit its properties
in the Object Info palette. Measurements are in page units.

 Click
to show/hide the parameters.
Click
to show/hide the parameters.
3. To edit or reorder the legend’s labels,
click Edit Labels.
The Data Visualization Legend Labels dialog
box opens.
On the left, the extracted values display.
Click on a value and drag within the column to change the order of the
labels. To change the label text, click on a label and enter the new name.
Click OK to return to the Object Info palette.
To delete a legend, select it and press the Delete key. This
is useful when more than one viewport on the sheet layer shares the same
data visualization, and only one legend is necessary, or when a legend
is not desired.
If a legend is accidentally deleted, create a new one from
the annotation space of the viewport. Right-click on the drawing and select
Create Data Visualization Legend from the context
menu.
~~~~~~~~~~~~~~~~~~~~~~~~~
Viewing the drawing by data or by attributes
The View bar
Creating annotations for sheet layer viewports
Was
this page helpful?