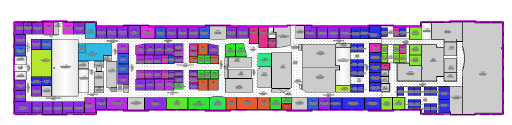
Vectorworks objects, especially BIM objects, contain a great deal of embedded data and record values that are not always visible or easily accessible, especially for more than one object at a time. Data visualization allows you to see the “big picture” of the data: an aggregate, dynamic view that displays drawing objects based on various data, whether general or specific, according to function, object type, value or range of values, or any other attached record parameters that you specify. This can be thought of as a graphical or visual report; one data set can be presented in a variety of ways.
Data visualization can be useful when checking for errors, performing quick plan checks, color coding portions of the drawing or sheet layer viewports for final presentations, and more. For example, you can view space objects according to occupancy, usage, floor area value range, or any other record or parameter property. You can view walls with colored threshold ranges according to wall height, and locate walls that are not at the correct height at a glance.
Data visualizations can be saved and applied to design layers and also to viewports on a sheet layer. When a visualization is modified, the modifications apply globally and instantly. Data visualization can easily be turned on or off from the View bar, to display the drawing with either a data visualization or the object attributes. Multiple data visualizations can be selected for display at one time.
Data visualizations can be saved not only in the current file, but also in the user folder and a workgroup folder, so that they can be used in other files and by other people in your organization.
Data visualization requires Top/Plan view. Document preference settings for Black and white only and Use layer colors do not apply when a data visualization other than <None> is selected for the drawing.
Viewport class overrides and data visualization cannot be used at the same time.
|
|
Click here for a video tip about this topic (internet access required). |
~~~~~~~~~~~~~~~~~~~~~~~~~
