Defining worksheet rows
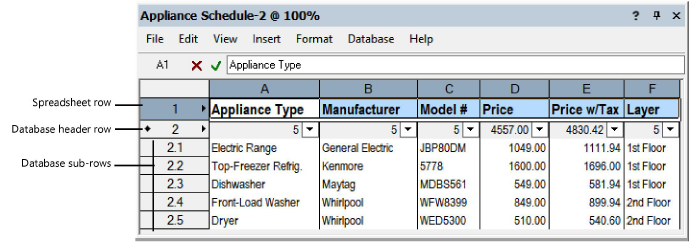
Worksheets can have two types of rows: spreadsheet and database. Generally, the cells in a spreadsheet row contain explanatory information. Database rows consist of a header row and sub-rows, and they show data that are associated with specific drawing objects. The database header row is identified by a diamond shape next to the row number, a gray background, and buttons in the right corner of each cell.
Three types of information can be defined for these rows: constant values (including text or numbers), formulas, and images (Vectorworks Design Suite required). In addition, a cell can reference another cell in the same worksheet or in another worksheet.
Text helps to identify the purpose of a worksheet and labels the columns in a worksheet.
Use formulas to perform calculations based on drawing data. A formula can be a simple mathematical equation, or it can include one or more built-in functions. The Vectorworks program provides mathematical functions (for example, a square root function), as well as functions that pull information from drawing objects (for example, a function that returns the volume of selected objects). See Worksheet functions for information about the functions available.
Images add visual information about items on a worksheet, and can also be used to create a drawing legend (Vectorworks Design Suite required).
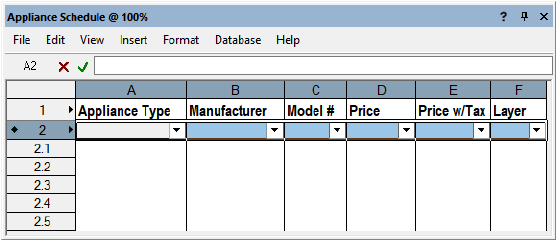
In the following example, spreadsheet row 1 contains labels for each column in the database. Database header row 2 has its criteria set to list all the objects in the drawing that have the appliance record attached to them. These objects display in sub-rows 2.1 through 2.5. For row 2, columns A through D list the contents of the data fields in the appliance record: the appliance type, manufacturer, model number, and price. Column E contains a formula, which uses the value in column D to calculate the price of the appliance with sales tax. Column F lists which layer of the drawing contains the object.

Spreadsheet rows
|
Command |
Path |
|
Spreadsheet |
Row context menu |
Spreadsheet rows are useful for creating explanatory information, such as column labels, column totals, drawing legends, and general calculations.
To define a spreadsheet row:
Right-click on the number of the row to change.
Select the command.
The cells in the row are empty until you define the contents. Select a cell, and then enter the desired information in the worksheet Formula bar located at the top of the worksheet.
To enter text or numbers, see Entering constant values in worksheet cells.
To enter a formula, see Entering formulas in worksheet cells.
To reference other cells in this cell, see Referencing other worksheet cells.
To insert an image, see Inserting images in worksheet cells.
Database rows
|
Command |
Path |
|
Database |
Row context menu |
Database rows display data fields, calculations, or images associated with the objects in a drawing. When you create the database row, set the criteria to determine which objects will be listed in the related sub-rows. For example, you might set a header row to list all chairs in the drawing. (If no object meets the header row criteria, no sub-rows are created.) You can specify multiple criteria; for example, create a list of all the chairs in a resort, or list only the green wing-backed chairs from all the two-room suites that are scattered throughout the resort.
In each cell in the database header row, specify which information about the objects to display in that column. A column can list a specific property of each sub-row object, such as its class or layer. A column can also list a data field contained in a record attached to each object. Alternatively, a column can contain a constant, an image, or a formula, just as a spreadsheet cell can.
To define a database row:
Right-click on the number of the row to change.
Do one of the following:
The easiest option is to select Create Report (or Edit Report, if you're editing an existing row), and then specify the database criteria and the columns to display as described in Creating reports.
Create a database row and sub-rows using a script with the function: Database(criteria)
If you're familiar with worksheets, select Database, and then use the following steps.
From The Criteria dialog box, specify which objects to include in the database.
In the worksheet, sub-rows are created beneath the header row for each drawing object that meets the criteria specified. The columns are empty until you define which data from the objects to display in each column.

From each cell in the database header row, specify the information to be shown in that column:
To list a simple property of each object (such as layer or class), or record data associated with each object (such as color or price), see Selecting a function or field for a database column.
To show the results of a formula for each object, see Entering formulas in worksheet cells.
To show an image for each object, select Insert > Image Function from the Worksheet menu. Alternatively, select Insert Image Function from the cell context menu. See Inserting images in worksheet cells.
Each sub-row cell displays the information requested. Each cell in the header row displays the total number of objects found, or, if the column returns numerical data, the header cell displays the sum for all sub-rows. Information found in each column can be sorted, summarized, and summed; see Cell context menu.
Once all the data is added, edit the worksheet as needed. For example, add rows or columns, change the text format, or add color.
Undefining a database row
A database row can be “undefined” to turn it into a spreadsheet row.
To undefine a database row:
Right-click on the number of the database header row to change.
Select Spreadsheet.
Undefining a database row removes the database row criteria and all sub-rows. Any formulas that were defined in the columns of the header row remain intact.