Influence lines
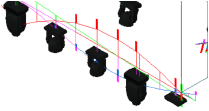
After a calculation, influence lines are placed on the structural elements of a drawing to graphically represent and assist with understanding the results. The influence lines represent the reactions and forces (shear, bending, torsion, and deflection) applied to the structural element by the loads hanging from the structure, and show where the force or reaction exerts its maximum effect upon the structure.
The influence lines are color-coded (by class) to represent various forces:
Deflection (dx, dy, dz, du): purple
Force (normal (Nx) and shear (Vy, Vz)): green
Torsional moment force (Mt): blue
Bending moment force (Mby, Mbz): red
The class names are determined by the settings on the Classes tab of the Braceworks preferences.
The Object Info palette of a selected influence line displays its specific deflection, force, torsion, and bending moment values. Forces applied to the tubing and braces of the structural element are also displayed.
In a complex drawing, you may wish to deselect Show Calculation Points, to make the drawing easier to interpret. Text with the relevant maximum value is placed at the top of the influence line; adjust this text with the Text Size parameter.
The heat map display for trusses can be adjusted in the Braceworks preferences to show the influence line values for a selected force (normal, shear, torsional moment, or bending moment).
Scaling influence lines
|
Command |
Path |
|
Scale Influence Lines |
Braceworks |
The influence lines in the drawing can be scaled to better view the maximum response of the reactions and forces exerted upon the structural elements.
Deselect Automatic Scaling in the Braceworks preferences for optimal results when scaling influence lines manually.
To scale the influence lines:
Select the command.
The Scaling Influence Lines dialog box opens. Each type of influence line is listed, with controls to change its scale by zooming or logarithmically.
The current scale factor of each influence line is displayed. Click + to enlarge the influence line display, or - to reduce it. Alternatively, drag the logarithmic slider to the right to enlarge, or left to decrease the influence line scale factor.