Creating Marionette charts
|
Mode |
Tool |
Tool set |
|
Insert
|
Marionette
|
Basic |
Use chart nodes to create a variety of charts in 2D or 3D, on design layers or sheet layers. Chart nodes can receive input from lists or worksheets, whether the worksheets are open or closed; see Concept: Worksheet overview for more information about worksheets. Use worksheet nodes to return string and numeric values from worksheet cells (to provide the data for charts) or to write values into worksheet cells (for example, to create tables of data for debugging purposes). Marionette charts are object nodes, which can be easily updated when their data inputs have changed; see Using object nodes.
To create a simple chart:
In Top/Plan view, click the tool and mode.
Click Current Node on the Tool bar. From the Resource Selector, locate the Charts category of node objects, and double-click on the desired chart node.
Click in the drawing to place the node.
Provide inputs for the chart node to specify the chart’s data, dimensions, and display. For more information about placing nodes and connecting them to form a network, see Inserting a node with the Marionette tool and Marionette networks.
Available in the Worksheets - Input category of node objects, worksheet nodes can provide numeric data and labels for chart nodes.
Click to show/hide the parameters.Click to show/hide the parameters.
|
Input |
Description |
|
Center |
Sets the center point of the chart’s bounding box. If no input is provided, the chart is placed at the document origin. |
|
Width/Height |
Sets the dimensions of the chart in document units |
|
RGB |
Sets the colors of the chart’s data objects (the bars, lines, or wedges that represent data). If no input is provided, the colors are generated automatically. |
|
Series |
Available for line charts and bar charts that use multiple data sets; provides labels for sets of data objects |
|
Labels |
Provides labels for the data objects. On bar charts and line charts, these are the X-axis data labels. |
|
Data/Values |
Provides numeric values for the data objects. On bar charts and line charts, these are the Y-axis values. |
With the chart node selected, click Settings on the Object Info palette to configure the chart.
The Chart Configuration dialog box opens.
Click to show/hide the parameters.Click to show/hide the parameters.
|
Parameter |
Description |
|
Settings |
|
|
Title |
Enter a title for the chart |
|
View Type |
Select 2D or 3D |
|
3D Depth |
Enter the height of the 3D chart in document units |
|
Layout |
Select the chart layout; the options vary by chart type |
|
Axis Titles (bar or line chart) |
Enter the X- and Y-axis titles |
|
Line Style |
|
|
Inner Objects |
Select the line type and line thickness of the chart’s data objects (the bars, lines, or wedges that represent data) |
|
Gridlines (bar or line chart) |
Select the line type and line thickness of the chart’s grid lines |
|
Display |
Toggle the display of the chart components |
|
Text Style |
Select text styles for the chart title and data labels |
|
Position |
Set the positions of the chart title and data labels |
Optionally, create a legend for the chart. This is useful when working with multiple data sets. Place a Legend node from the category and provide inputs for the legend items and colors.
To run the script and create the chart, right-click on any node in the network and select Run Marionette Script from the context menu. Alternatively, select any node in the network and click Run on the Object Info palette.
The chart is created as an object node at the specified location.
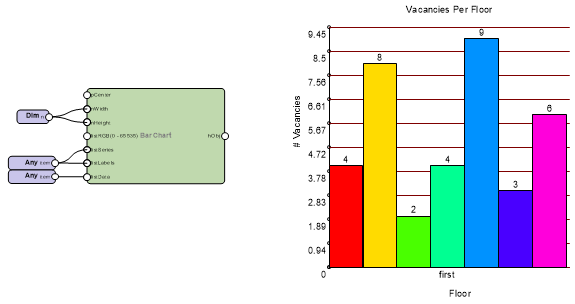
2D bar chart
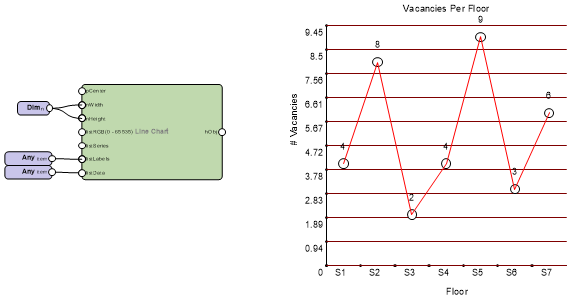
2D line chart
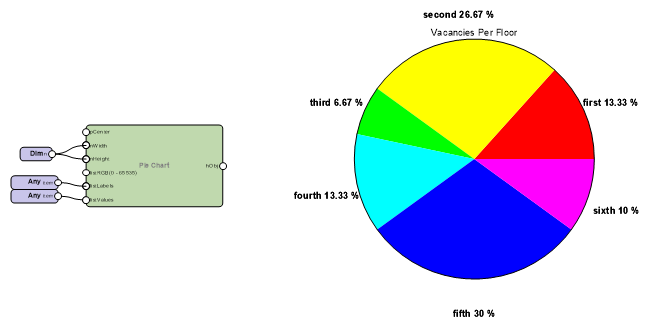
2D pie chart