Creating a new data visualization
|
Command |
Path |
|
New Data Visualization |
View bar Viewport Object Info palette |
A data visualization defines the objects that are included (the object criteria portion of the definition) and also the values from the object, or from other sources, to be used as the basis for changing the object attributes or hiding the objects (the display criteria portion). This combination provides an extremely flexible method for visualizing embedded data in your drawing or model.
The Data Visualization menu is only available from the View bar when a design layer is the active layer.
To create a data visualization:
Select the command.
You can also create a data visualization from the Manage Data Visualizations dialog box.
The New Data Visualization dialog box opens.
Click to show/hide the parameters.Click to show/hide the parameters.
|
Parameter |
Description |
|
Visualization Name |
Enter the visualization name; the name must be unique |
|
Change Attributes |
Changes the attributes of objects that meet specified criteria |
|
Hide |
Hides objects that meet the specified criteria |
|
Define Criteria |
Opens the Criteria dialog box to define the kinds of objects to consider in the visualization; after defining the criteria, the selection formula displays, along with the number of objects that meet the criteria. |
|
Object Criteria |
Displays the current object selection formula |
|
Display Criteria |
These settings define how the objects specified in the Criteria dialog box will be visualized. Different options are available depending on whether you're changing attributes of objects or hiding objects. |
|
Object category |
Select a general category of objects to define display criteria for, and then additional options become available. For example, if you select Objects using Parameter, object and parameter lists display so that you can make your selections. |
|
All Objects |
Applies a single attribute to all objects that meet the criteria, or hides them |
|
Objects using Parameter |
Select the type of plug-in object, and then a parameter from that object that contains values or ranges of values of interest (for example, space and type of occupancy) |
|
Objects using Record |
Select the record that contains the data you want to visually differentiate, and then select the record field (for example, plant record and light range). |
|
Objects using IFC Entity |
Opens the Select IFC Object dialog box; select an entity, and then select a pSet name and property. To use one of the IFC entity's "base" values (such as "name"), select the IFC entity name from the pSet name list. |
|
Objects using Function |
Select an object-specific function (for example, area or material). Only class and material functions can be applied to individual components. |
|
By values |
Sets attributes or hides objects according to a value, text or numerical, from the selected display criteria. For each value in the list, click Edit to open a dialog box where you can define its attributes or set the Hide option. |
|
By ranges |
Sets attributes or hides objects according to ranges of numeric values from the selected display criteria. For each desired range, click Add or Edit to open a dialog box where you can define its attributes or set the Hide option. |
|
Value/Range list |
Lists the values or ranges for the selected objects, along with the current settings. A check mark in the Apply or Hide column indicates that the attributes will be applied for this row or it will be hidden. Click to toggle the check mark on or off. When issues occur with a data visualization, this is one of the first areas to consider for troubleshooting. Ensure that the desired rows have a check mark. |
|
Add |
Opens a dialog box to set attributes or the Hide option for a new value or range |
|
Edit |
Select a value or range from the list and click Edit (or double-click on a row) to open a dialog box where you can edit the item's attributes or set the Hide option, or adjust the ranges if needed |
|
Delete |
Deletes the currently selected value or range |
|
Auto-Color |
If Change Attributes is selected, automatically assigns fill and/or pen colors to the rows based on the Color Settings |
|
If Change Attributes is selected, opens the Auto-Color Settings dialog box to set colors for the auto-color feature. For both the fill and pen, select whether to use the auto-color feature. Then select the auto-color options: Select Use colors to specify the starting and ending colors for the rows. The automatic colors will be a gradient between the two colors. Select Use palette to specify a palette. The automatic colors will come from the palette, in order; if there are more rows than colors in the palette, the colors start over from the beginning. If the auto-color option is deselected for fill or pen, select the row colors for that attribute manually instead. |
|
|
Export as Palette |
If Change Attributes is selected, opens the New Palette dialog box; see Creating or editing custom color palettes. A color palette, named after the current data visualization, is automatically created based on the colors applied to the rows of values or ranges, and the colors are available for selection. |
|
Clear Unavailable Values |
Deletes values that don't exist in the document from the value list; if not cleared, these values are grayed |
|
Refresh Values |
Updates the value list with values that are available in the document, but not currently on the list |
|
Draw Mode for All Other Objects |
Determines how objects that are not affected by the visualization are displayed: shown normally, grayed, or hidden. If a data visualization with the Gray option is applied to a viewport, class overrides cannot be applied to the viewport. |
Select whether the visualization will change the attributes of objects or hide them.
Click Define Criteria to select the objects to include in the visualization, such as particular layers, objects, and textures. The Criteria dialog box opens. Specify the criteria as described in The Criteria dialog box.
Once the object criteria are defined, specify a group of objects to define display criteria for; this determines the values or ranges of values to be differentiated. The visualization will report the data selected here.
When new display criteria are selected, an alert opens, confirming that you wish to change all of the values in the list. This prevents you from accidentally deleting previously specified attributes.
If you select the option to visualize objects By values, a list of values displays. For the By ranges option, click Add to define each range.
If the visualization is set to Change Attributes, you can click Auto-Color to automatically determine a different color for all items in the rows based on the selections for fill and/or pen in the Auto-Color Settings dialog box.
Otherwise, select one or more rows, and click Edit. If the visualization is set to Change Attributes of objects, the Edit Attribute Value or Edit Attribute Range dialog box opens. If the visualization is set to Hide objects, the Edit Visibility Value or Edit Visibility Range dialog box opens.
Click to show/hide the parameters.Click to show/hide the parameters.
|
Parameter |
Description |
|
Apply attributes
|
If the visualization is set to Change Attributes of objects, select whether to apply the attributes to this value/range. When issues occur with a data visualization, this is one of the first areas to consider for troubleshooting. Ensure that the desired rows have a check mark. |
|
Hide |
If the visualization is set to Hide objects, select whether to hide or show this value/range |
|
Value (By values) |
Displays the name of the current value; the name can be changed |
|
Lower Bound (By ranges) |
Sets the lower limit of the range to an infinite value or to the specified value |
|
Upper Bound (By ranges) |
Sets the upper limit of the range to an infinite value or to the specified value |
|
Attribute Values |
If the visualization is set to Change Attributes of objects, you can set fill, pen, texture, and drop shadow attributes for this value/range. Alternatively, select the Retain Original option to keep the original attributes of objects. When a visualization is applied to a viewport that has class overrides, the Retain Original option uses the viewport overrides, rather than the original object attributes. See Concept: Attributes for information on applying attributes. An override for a class texture cannot be retained in a visualization. Override options allow for flexibly setting the fill, pen, foreground, or background attribute colors of the objects. Available overrides depend on the attribute selection, except for opacity, which can be overridden unless None is selected for fill or pen. Set the Texture to None to display fill overrides from the data visualization when rendering. |
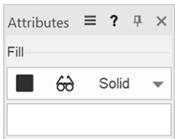
When attributes are controlled by a data visualization, the Attributes palette displays with a glasses icon
Click OK to save the data visualization. The name displays in the Data Visualization menu.
If you created a new data visualization from the Object Info palette of a selected viewport, it's automatically applied to that viewport and any other selected viewports.