The Debug log
The Debug log contains settings, records all events that occur from the server startup, and other information about the server and its environment; it can provide useful hints when troubleshooting. The Debug log is automatically created at installation; by default, it is located in the Program Data folder.
Opening the Debug log
Access: Select Diagnostics > View Debug Log from the site protection System Menu.
Alternatively, click View Debug Log from the Home screen Server menu.
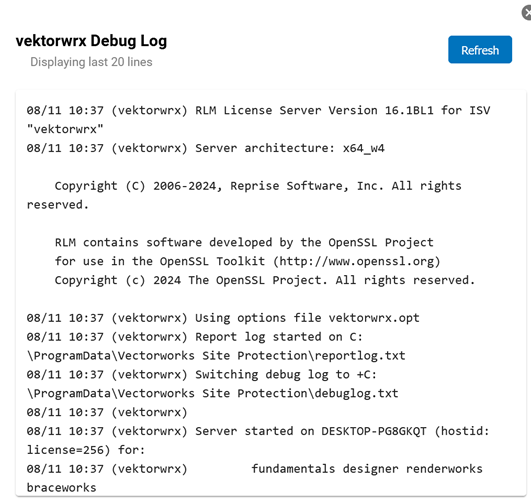
Description: Displays the last 20 lines of information related to the ISV server from the Vectorworks Site Protection Server command window. The information consists mainly of the records of the Vectorworks clients using or returning licenses.
Many of these functions are accessed more conveniently through the Site protection System Menu. The Debug log must be created before it can log data. See Switching to a different Debug log file.
Click Refresh to reload the Debug Log information.
Switching to a different Debug log file
Once a Debug log has been created, you can switch from using the current Debug log and specify a different log file, without shutting down the server.
To record any data in the Debug log, you must first create the log from the command prompt/terminal.
Click Switch Debuglog from the Server menu of the server administration Home screen.
The Switch Debuglog screen opens.
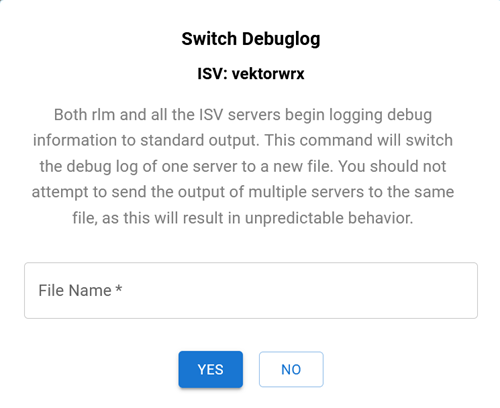
In File Name, enter the file path where the log is located, including the filename.
Click Yes.
The Debug log switches to the other file.