Select the Create Report command from the appropriate menu:
● Fundamentals, Architect, Landmark workspaces: Tools > Reports > Create Report
● Spotlight workspace: Spotlight > Reports > Create Report
The Create Report dialog box opens. Specify the report criteria. Items in the Worksheet Columns list are listed in the order in which they will appear in the worksheet; to change the order, click on the # column and drag the item to the desired position in the list.
Click to show/hide the parameters.
The Create Report Options dialog box opens.
Click to show/hide the parameters.
Specify the options for creating the report, and click OK to return to the Create Report dialog box.
Click OK to create the worksheet.
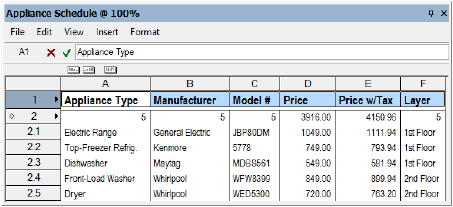
The worksheet opens automatically. The top row of the worksheet contains a title for each column selected. Next is a database header row (indicated by a diamond next to the row number) that contains sub-row totals for each column. Beneath the header row are sub-rows for each object or symbol in the drawing that matches the report criteria.
To add more data to the worksheet, repeat steps 1 through 4 and select the Append to existing worksheet option.
Once all the data is added, edit the worksheet. For example, add rows or columns, change the text format, or add color. To hide the database header rows, toggle the Database Headers setting from the Worksheet menu.