 Exporting IFC data for structural gridsExporting IFC data for structural grids
If you use the Grid Line, Grid - Polar, or Grid - Rectangular tool to create a structural grid, Vectorworks automatically assigns all the necessary IFC data types and values to the grid and axes.
IFC grids are associated with their design layer at export. Up to three grid sequences on a layer are automatically combined into a grid and exported as IfcGrid. Individual grid lines created with the Grid Line tool are exported as IfcGridAxis. The first grid sequence on a layer becomes the UAxes collection, and every grid line in that sequence is exported as IfcGridAxis from the UAxes collection. The second grid sequence (if one exists) on the layer exports as VAxes, and the third grid sequence (if one exists) on the layer exports as WAxes. To be compliant with IFC, there can be no more than three grid sequences on a design layer; any additional grid sequences on a layer are omitted from the export. Place additional grid sequences on other layers to ensure they export correctly.
If you create a custom grid using the Line and/or Circle tools, manually attach IFC data to the line and circle objects, and to the grid itself.
To attach and export IFC data for a custom grid:
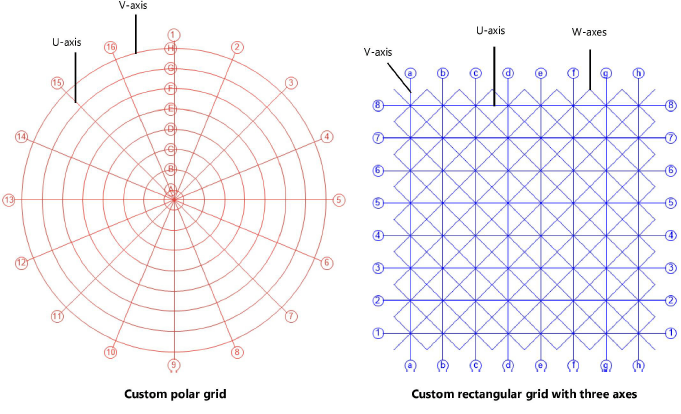
1. Draw the desired grid using the Line and/or Circle tools. You can add text in circles (or rectangles) for labels at the end of each line for your own information, but these are not required for IFC export.
2.Select each grid line (do not include the labels) and use the Attach IFC function in the Object Info palette to attach the IfcGridAxis entity to each line. In the AxisTag field for each grid line, enter U, V, or W to indicate the type of line, followed by the line name or tag (for example, U1, U2.2, U03, VA, VAA, and so on).
● For a typical rectangular grid, all grid lines parallel with the X-axis begin with U. Lines parallel to the Y-axis begin with V.
● For radial, or polar, grids, the radiating spokes begin with U, and the concentric circles begin with V.
● You can also have more than two axes, such as for a 3-axis diagrid or rotated sub-grids adjacent to, or inside, a primary orthogonal grid. These additional axes begin with W.
3.When all grid lines have IFC data attached, select them all (optionally including the labels) and group them.
4.Select the grid group, and use the Attach IFC function in the Object Info palette to attach the IfcGrid entity to it. You can also give the group a name, such as “Building Grid” or “Structural Grid.”
5.When you export the IFC project, either select the CV2.0-Architecture Model View option, or be sure that any custom IFC data mapping settings include IfcGrid.
6.To check the IFC export, open the resulting IFC file in Solibri Office and set grids to show. Notice that there are labels at the ends of each of the grids. These are not the labels or bubbles you might have created; they are auto-generated from the IFC file code and Solibri.
~~~~~~~~~~~~~~~~~~~~~~~~~