Obtaining site model data
Site model section
|
Command |
Workspace: Path |
|
Site Model Section |
Architect: AEC > Terrain Landmark: Landmark |
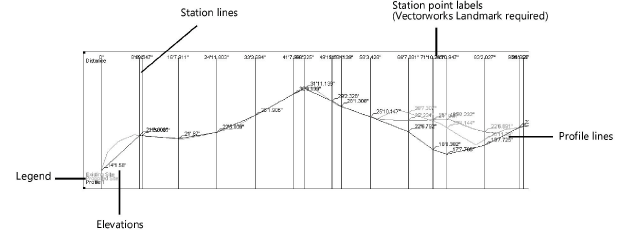
The Site Model Section command creates a profile or sectional view of the site.
To create a site model section:
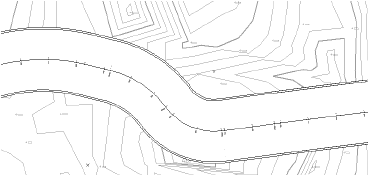
Draw or select a 2D polygon or polyline to define the section alignment. In the Vectorworks Landmark product, if you are selecting a previously drawn polyline with station points (such as a road or Roadway (Poly) object), a station point profile can be created.
The polygon or polyline vertices must be contained within the limits of the site model.
With the polygon or polyline selected, select the command.
The Create Site Model Section dialog box opens. Specify the site model section parameters.
Click to show/hide the parameters.Click to show/hide the parameters.
|
Parameter |
Description |
|
Create section on layer |
Specify the layer where the section will be placed |
|
Draw Background Grid |
Draws a background grid; click the color box to specify the grid color |
|
Draw Existing Site Profile |
Draws a profile for the existing site model; click the color box to specify the profile color |
|
Draw Proposed Site Profile |
Draws a profile for the proposed site model; click the color box to specify the profile color |
|
Draw Selected Station Profile (Landmark required) |
Draws a profile of the station points; click the color box to specify the profile color; this option is available only if a polyline associated with station points (such as a road) is selected |
|
Station Points |
|
|
Draw points at polygon vertices |
If the selected polygon does not contain stake objects, creates station points at the polygon vertices; this option is available only if a station polyline is selected |
|
Draw points at interval |
If the selected polygon does not contain stake objects, creates station points at the specified interval |
|
Draw points at existing stakes (Landmark required) |
When stakes exist along the profile polygon, station points are automatically created for the stakes; this option is available only if a polyline with station points (such as a road) is selected |
|
Formatting |
Click to specify the section graphic formatting |
The Site Model Section Formatting dialog box opens. Specify the formatting for the site model section graphic.
Click to show/hide the parameters.Click to show/hide the parameters.
|
Parameter |
Description |
|
Display Scale Factor |
Specifies the site model scale factor; the layer scale factor is entered by default |
|
Vertical Magnification Factor |
Sets an independent scale factor for the Y axis of the graphic |
|
Vertical Margin |
Specifies the distance, in page units, between the highest and lowest points in the graph and the graph margins |
|
Horizontal Margin |
Specifies the distance, in page units, between the graph start and end and the graph margins |
|
Draw Legend Text |
Indicates whether to create a legend for the graph; legend text is color coded to match the section profiles |
|
Legend point size |
Specifies the size, in points, of the legend text |
|
Draw Elevations |
Indicates whether to display the elevation of the profiles along the station points |
|
Elevation point size |
Specifies the size, in points, of the elevation text |
|
Station Point Labels (Landmark required) |
Sets the type of label, if any, to apply to the station points on the background grid |
|
Profile Line Weight |
Specifies the thickness of the profile lines |
|
Station Line Weight |
Specifies the thickness of the station lines |
Click OK to return to the Create Site Model Section dialog box.
Click OK to create the sectional view of the site. If the site model changes, the site model section needs to be recreated.