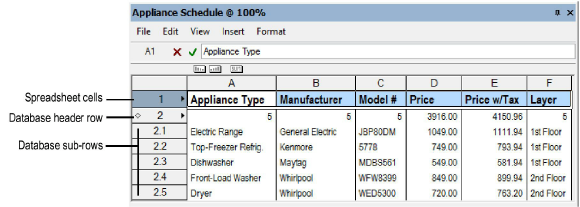
Database rows display data fields, calculations, or images associated with the objects in a drawing. The database header row is identified by a diamond shape next to the row number. When you create the database row, set the criteria to determine which objects will be listed in the related sub-rows. For example, you might set a header row to list all symbols in the drawing. A sub-row would then be generated for each symbol in the drawing. (If no object meets the header row criteria, no sub-rows are created.)
Many criteria combinations can be specified, such as class, object type, record information, or line weight. For example, create a list of all the rooms in a resort, or list only the green wing-backed chairs from all the two-room suites that are scattered throughout the resort.
In each column in the database header row, specify which information about the objects to display. A column can list a specific attribute of each sub-row object, such as its class or layer. A column can also list a data field contained in a record attached to each object. Alternatively, a column can contain a constant, an image, or a formula, just as a spreadsheet cell can.
In the following example, database header row 2 has its criteria set to list all the objects in the drawing that have the appliance record attached to them. Columns A through D list the contents of the data fields in the appliance record: the appliance type, manufacturer, model number, and price. Column E contains a formula, which uses the value in column D to calculate the price of the appliance with sales tax. Column F lists which layer of the drawing contains the object.

To create a database row:
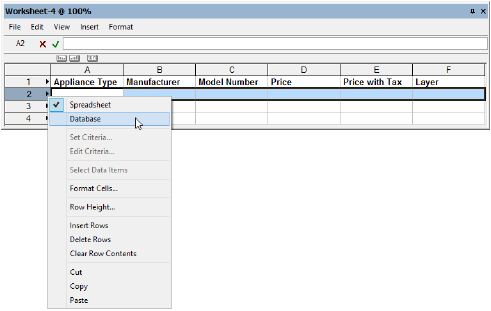
Right-click (Windows) or Ctrl-click (Mac) on the number of the row to change.

From the Worksheet row menu, select Database.
The Criteria dialog box opens.
Specify the selection criteria for which objects to display in the sub-rows. The number of objects that meet the criteria displays, to help you verify that the criteria is correct. To specify additional criteria, click More Choices.
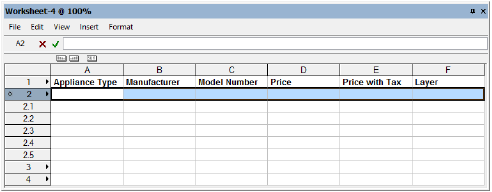
Click OK to enable database functionality for the row. Beneath the header row, sub-rows are created for each drawing object that meets the criteria specified. The columns are empty until you define which data from the objects to display in each column.

Select each database header cell, and specify the information to be shown in each column of the row:
● To list attributes of each object (such as layer or class), see Retrieving Object Attributes in a Worksheet.
● To list record data associated with each object (such as color or price), see Retrieving Record Information in a Worksheet.
● To show the results of a formula for each object, see Entering Formulas in Worksheet Cells.
● To show an image for each object, select Insert > Image Function from the Worksheet menu. Alternatively, select Insert Image Function from the context menu. See Inserting Images in Worksheets.
Each sub-row cell displays the information requested. Each cell in the header row displays the total number of objects found, or, if the column returns numerical data, the header cell displays the sum for all sub-rows. Information found in each column can be sorted using the ascending, descending, and summarize buttons; see Database Row Sort and Summary Functions.
To undefine a database row:
Right-click (Windows) or Ctrl-click (Mac) on the number of the database header row to change.
Select Spreadsheet.
Undefining a database row removes the database row criteria and all sub-rows. Any formulas that were defined in the columns of the header row remain intact.
A drawing object can have several attributes, such as the layer it is on, the type of object it is, the symbol name (if it is a symbol), and whether it is currently selected. You can display this information in the database rows of a worksheet.
To retrieve object information in the database rows:
Click the cell in the database header row where the formula will be entered.
Enter an equal sign (=), and then enter the criteria to display. For example, enter =C to display the name of the class to which each object belongs. The entries display in the worksheet Formula bar.
Code |
Criteria Name |
Code |
Criteria Name |
|
ALL |
Every object |
PF |
Pen Foreground |
|
AR |
Arrowhead |
PLA |
Plane |
|
ASZ |
Marker size |
PON |
Plug-in object name |
|
C |
Class name |
PP |
Pen pattern (same as LS) |
|
FB |
Fill background |
R |
Object record |
|
FF |
Fill foreground |
RST |
Roof style |
|
FOT |
Font |
S |
Symbol name |
|
FP |
Fill pattern |
SEL* |
Selection status |
|
FSZ |
Font size |
SLST |
Slab style |
|
GFI |
Gradient fill |
SST |
Sketch style |
|
HFI |
Hatch fill |
ST |
Object subtype |
|
IFC_ENTITY |
IFC entity |
STO |
Story |
|
IFI |
Image fill |
T |
Object type |
|
L |
Layer name |
TFI |
Tile fill |
|
LS |
Line style (same as PP) |
TSTY |
Text style |
|
LT |
Line type |
TX |
Texture |
|
LW |
Line weight |
V |
Visibility |
|
N |
Object name |
VSEL* |
Visible selection status |
|
OPA |
Opacity |
WST |
Wall style |
|
PB |
Pen background |
|
|
* When used with the COUNT function, the SEL criterion counts objects that are actually non-selectable, such as the individual items within a group. The VSEL criterion counts only the visibly selected items, which is the same counting method used for the Object Info palette. For example, if you select and count a group that has 11 items in it, the SEL criterion returns a value of 12 (the group, plus the 11 items). The VSEL criterion returns a value of 1 (the group only).
Click the green check mark to validate the entry.
Database records are created in the Record Formats dialog box. These records are then assigned to objects through the Data tab of the Object Info palette. See Viewing and Editing Object Records for more information. This information can be displayed in the database rows of a worksheet.
To retrieve record information in a database row:
Click the cell in the database header row where the formula will be entered.
Enter an equal sign (=), and then enter the record information to display. The entries display in the worksheet Formula bar. The syntax for retrieving record information is:
Syntax |
Example |
|
=record name.field name |
=Furniture.Type |
A period (.) must separate the two names, or the formula will not be executed.
If the name of the record format or field name contains spaces, the name must be enclosed with single quotes as in the following example: =‘Appliance Record’.‘Model Number’
Click the green check mark to validate the entry.
The database information attached to each object displays in the sub-rows.
You can use the database rows in a worksheet to select the objects in the drawing that are related to that row. If Vectorworks Design Series is installed, you can also edit the information associated with many database objects from the worksheet.
To select database objects:
Either all database objects or a single database object can be selected.
● To select all database objects that meet the database row criteria, right-click (Windows) or Ctrl-click (Mac) the row number of the database header row to open the context menu.
● To select an individual database object, right-click (Windows) or Ctrl-click (Mac) the row number of the sub-row that contains the object to open the context menu.
From the context menu, select either Select Data Items or Select Item.
All database objects that are represented by the header row, or the individual row object, are selected. If an individual object is selected with Select Item, the drawing view changes to display the selected object. The Select Item command is unavailable if the sub-row is summarized (see Database Row Sort and Summary Functions).
 To edit database objects:
In database sub-rows, some information can be edited, but some cannot. For example, the results of a calculation cannot be edited. However, if Vectorworks Design Series is installed, the data associated with a database object can be edited in the worksheet, and the object’s data record will be updated as well. For details, see Editing Cell Contents.
~~~~~~~~~~~~~~~~~~~~~~~~~
