Controlling visibility and appearance with phasing
You can control the visibility and appearance of objects in a phase by using data visualizations and a combination of document preferences and preferences set for each individual sheet layer viewport. For example, you can use these controls to show only the objects that are are present in the active phase and can apply a different appearance to indicate at a glance objects that are created or removed in the phase.
Data visualizations and phasing
Use data visualizations to control both the visibility and the attributes of drawing objects based on their status in the active phase of a design layer or in the selected phase for a sheet layer viewport. With no data visualizations applied, you can't distinguish which changes are made in which phase. If the same data visualization is applied as you change the active phase, the appearance of the objects in the drawing changes as their status in the active phase changes. Some objects may be shown or hidden, and the attributes of other objects change depending on their status. Vectorworks provides several data visualizations with commonly used settings for phasing as part of the Architect and Interior templates, and you can use phasing-related criteria to create custom data visualizations as needed.

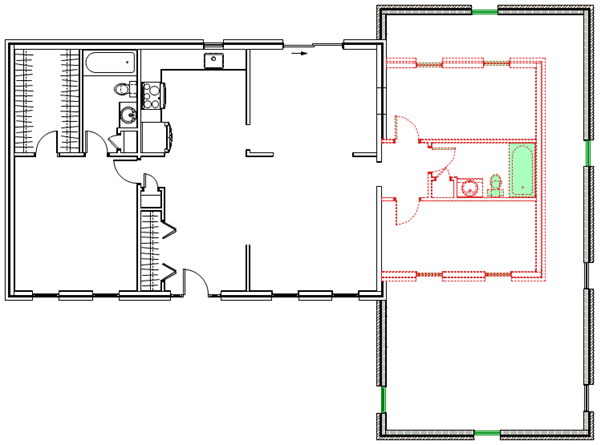
Without a data visualization applied, you can't distinguish between the original as built instance of this window, on the left, and the instance relocated in phase 2 on the right.
Apply data visualizations to set the appearance of objects based on their phase status. If multiple data visualizations are applied, the order in which they are applied matters; at the end of each applied data visualization, a number in parentheses indicates the order of data visualizations. In most cases, it is best to apply all Hide type data visualizations before the Attributes type visualizations. To change the order, deselect applied data visualizations, and then reselect them in the desired order. See the help section beginning with Viewing the drawing by data or by attributes to use data visualization in a drawing.
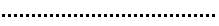
This data visualization defines how objects should appear according to their status in the active phase. Most notably in this view, all objects with a status of Demolished or Removed in the active phase display with a red dashed line. Objects with a status of Removed or Relocated have a green fill. Objects with a status of New use their own object attributes. Objects with a status of Existing have a white fill.
Detail level preferences and phasing
In a design layer, use document preferences to set a low detail level for component-based objects and/or plug-in objects and symbols if their Status in Active Phase is Existing or Removed. These preferences override the file's general detail level settings and allow you give existing or removed objects a different emphasis in the design layer. You can, for example, show all existing and removed objects in low detail, so they provide context for new objects while allowing the new objects to stand out. You can also set these phase-based low detail overrides for objects on each sheet layer viewport or viewport style. See Document preferences: Display tab, Creating sheet layer viewports, or the help topic for creating a specific kind of sheet layer viewport, such as section or interior elevation.
The low detail for existing objects preferences are deselected on the left, and selected on the right, where only objects with a Status in Active Phase of New appear with high detail