 Applying a data visualization
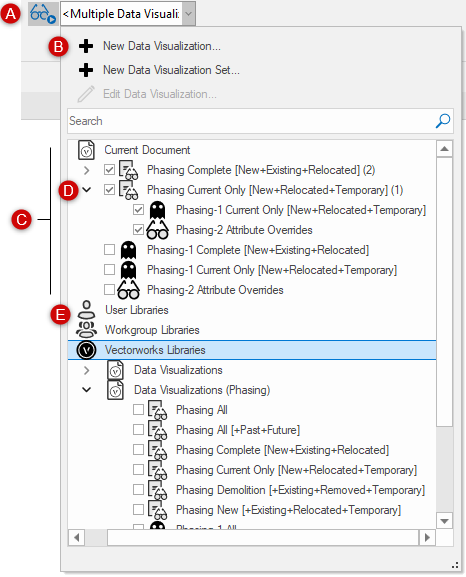
You can apply one or more data visualizations and visualization sets to design layers, saved views, sheet layer viewports, and viewport styles. The Data Visualization menu lists the data visualizations/sets available in the current file, in user and workgroup folders, and in Vectorworks libraries. Use the commands at the top of the menu to create and edit visualizations and data visualization sets.
|
Item |
Description |
|
Enable Data Visualization
|
Available only on the View bar when a design layer is active, toggles the selected visualizations on or off in the design layer without changing the selections. |
|
Data visualization commands
|
Create and edit data visualizations and data visualization sets. When a single data visualization or visualization set is applied, the Edit Data Visualization command edits that visualization/set. See Creating a data visualization, Creating a data visualization set, and Editing the current data visualization. |
|
Data visualizations and sets in the active file
|
Lists all data visualizations and sets included in the active file; every simple data visualization that is included in a visualization set is also listed separately. The icon to the left of a visualization name indicates whether the data visualization changes object attributes A check mark indicates a data visualization or set is applied. A number to the right of each applied visualization indicates its priority. If there is a conflict, the visualization with the lower number takes precedence. To change priority, deselect and reselect visualizations in the desired order. |
|
Data visualization set disclosure
|
Displays or hides the data visualizations included in the set. Sets can be activated, and then individual visualizations in a set can be activated or deactivated as needed for the context, without changing the saved set. Applied data visualizations are remembered independently for design layers, saved views, and viewports, so the same set can be used in multiple contexts with different simple data visualizations applied. |
|
User, workgroup, and Vectorworks libraries
|
Place a check mark beside the visualizations/sets to add to the active file, and then click in the drawing area. Data visualization sets in libraries aren't expandable, so the included visualizations can't be viewed from here. |


 or hides objects
  , or if it is a data visualization set
  .
. 

Applying a data visualization to a design layer
To apply a data visualization to a design layer:
Click the Data Visualization menu on the View bar.
Select the data visualizations/sets to apply; if needed, enter text in the search box to filter the list. Within an applied visualization set, select which visualizations to apply.
Alternatively, double-click a data visualization/set from the Resource Manager to activate it, or drag it to the design layer.
When closed, the top of the menu displays the selected visualization name, or it indicates that multiple visualizations or no visualizations are selected.
Click Enable Data Visualization to toggle the selected visualizations on or off. When the toggle is off, the menu displays with <None> and all visualizations are deselected; however, the previously selected visualization status is remembered. If you toggle the visualizations back on, previously selected visualizations are reapplied.
The toggle button indicates the status of the data visualization feature:
 Disabled: No data visualizations are selected, and the data visualization feature is off. Select a data visualization to turn on the feature.
 Run: Data visualizations are selected, and the data visualization feature is on (your highlight color may be different). The drawing displays with the selected data visualization settings.
 Pause: Data visualizations are selected, but the data visualization feature is paused, so the drawing displays with object attributes. Click the toggle to apply the selected data visualizations again.
In Spotlight, data visualizations apply to lighting device geometry without affecting the label legend. To set the label legend attributes, see Creating label legends.
Applying a data visualization to a saved view
To apply data visualizations or data visualization sets to a saved view:
From the Saved View dialog box, select Save data visualization.
Click in the Data Visualization field to select the data visualizations/sets to apply; if needed, enter text in the search box to filter the list. Within an applied visualization set, select which visualizations to apply.
When closed, the top of the menu displays the selected visualization name, or it indicates that multiple visualizations or no visualizations are selected.
Deselect Save data visualization or Restore data visualization to toggle the selected visualizations off. When the toggle is off, visualizations are not applied to the saved view; however, the previously selected visualization status is remembered. If you toggle the visualizations back on, previously selected visualizations are reapplied.
Applying a data visualization to a viewport
Data visualizations/sets can be applied to a viewport on a sheet layer, and to viewport styles for sheet layer viewports. If the viewport has class or layer overrides, note the following:
Class viewport overrides: If the data visualization is set to Change Attributes of objects, in general, data visualization settings take precedence over class overrides in the viewport. However, you can set options to retain the original fill, pen, drop shadow, or texture in the data visualization attributes, which will retain the class overrides.
Layer viewport overrides: Data visualizations prevent layer viewport overrides from displaying. Turn off data visualizations in a viewport to display the override settings.
Advanced viewport settings for Black and white only and Use layer colors do not apply when a data visualization is selected for the viewport.
To apply a data visualization or visualization set to a sheet layer viewport or viewport style:
Do one of the following:
When creating the viewport, select the desired data visualization/set. If desired, also select the option to automatically create a data visualization legend now and whenever a new data visualization is applied to the viewport.
For an existing, selected viewport, select the data visualization/set to apply from Data Visualization on the Object Info palette. If Create data visualization legend is selected, a legend is automatically created; deselect the option to toggle the legend off.
For a viewport style, select the data visualization/set to apply from the Viewport Style dialog box, and set the selection to be by style or by instance for viewports that use the style. If desired, also select the option to automatically create a data visualization legend now and whenever a new data visualization is applied to the viewport.
Double-click a data visualization/set from the Resource Manager to activate it, or drag it to the viewport.
Apply multiple data visualizations, if desired. Select data visualizations that do not conflict with each other. You can also create a new data visualization/set from any of these locations.
Data visualization legends
When a data visualization is assigned to a sheet layer viewport, a legend can be automatically created, edited, or deleted within the annotation layer of the viewport (unless the data visualization and its legend are controlled by the viewport style). If multiple visualizations are selected for the viewport, a legend can be created for each visualization. If a data visualization set is applied, a separate legend is created for each data visualization (that is selected for use in the current viewport) within the set. Click Create data visualization legend when creating the viewport or in the Object Info palette of a selected viewport to toggle the legend on or off.
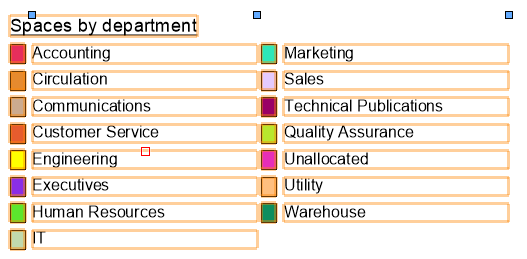
Control points at the top of the legend adjust the spacing between the swatches and labels, and the overall legend width
To edit the legend properties:
Right-click on a viewport with a data visualization legend and select Edit Annotations from the context menu.
Select the legend to view and edit its properties in the Object Info palette. Measurements are in page units.
Click to show/hide the parameters.Click to show/hide the parameters.
|
Parameter |
Description |
|
Title |
The legend is named after the data visualization by default; enter new label text to change it |
|
Swatch Coloring |
Select the combination of background and foreground fill and pen for the color swatches; only available for visualizations that change object attributes |
|
Swatch Width/Height |
Specifies the color swatch width and height; only available for visualizations that change object attributes |
|
Overall Width |
Specifies the overall legend width |
|
Note Text Indent |
Sets the distance to indent the label text; only available for visualizations that change object attributes |
|
Line Spacing |
Sets the spacing of each line in the legend |
|
# of Columns |
Sets the number of columns, up to four |
|
Gutter Width |
When more than one column is selected, sets the distance between the columns |
|
Break Note Text Across Columns |
When more than one column is selected, allows text to break across columns; when deselected, text for each note does not break to the next column |
|
Text Alignment |
Specifies the alignment of the note text |
|
Edit Labels |
Opens the Data Visualization Legend Labels dialog box, for reordering labels and changing label text |
|
Format Title Text |
Opens the Format Text dialog box; see Formatting text |
|
Format Label Text |
Opens the Format Text dialog box; see Formatting text |
To edit or reorder the legend's labels, click Edit Labels.
The Data Visualization Legend Labels dialog box opens.
On the left, the extracted values display. Click on a value and drag within the column to change the order of the labels. To change the label text, click on a label and enter the new name. Click OK to return to the Object Info palette.
