 Viewport Data VisualizationViewport Data Visualization
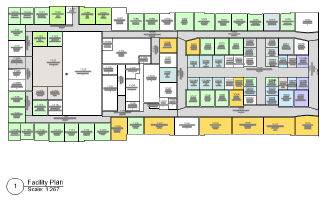
Viewport data visualization allows you to control the attributes of objects in a sheet layer viewport according to the data present in their attached record formats. This method allows for flexible viewport display options by value or by ranges of values. Using the record data attached to objects allows you to visualize the object data in the viewports according to function, object type, or any other attached record parameter. For example, you can view the space objects in a viewport according to occupancy, usage, floor area value range, or any other record or parameter property. One data set can be presented in a variety of ways.
The visualization is an effect applied to the viewport; no drawing objects are affected. Viewport data visualization requires wireframe rendering mode.
Data visualization settings can be transferred from one viewport to another with the Eyedropper tool; see Transferring Attributes.
Class overrides and data visualization cannot be used for a viewport at the same time.
To change the appearance of viewport objects based on attached record data:
Select the sheet layer viewport.
From the Object Info palette, click Data Visualization.
The Viewport Data Visualization dialog box opens.
Click to show/hide the parameters.
Select the record format and one of its record fields, and then choose whether to apply the visualization effect by numerical range (Attribute Ranges) or by value (Attribute Values). Determine whether to include groups and symbols among the objects to be considered.
The visualization effect applies to the records applied to symbol definitions and group containers, and not to records attached to objects within the symbol definition or group.
If setting attributes by range, click Add or Edit to specify the range values and attributes.
The Edit Attribute Range dialog box opens. Set the range limits and attributes, and click OK.
Click to show/hide the parameters.
If setting attributes by value, the values associated with the selected record field are listed, set to default attributes. Select a value and click Edit to specify the value’s attributes.
The Edit Attribute Value dialog box opens. Set the value attributes, and click OK.
Click to show/hide the parameters.
Several rows in the Options list can be selected at one time, changing any of the attributes of the selected row. When the attributes of the ranges or values have been set, save the settings as a set for reuse by clicking Save, if desired.
To enable the visualization effect for the selected viewport, select Enable Data Visualization for This Viewport. Individual rows in the Options list can also be enabled or disabled by clicking in the Apply column.
Click OK to return to the viewport.
If you have saved settings for viewport data visualization, you can rename or delete these saved settings when needed.
To manage saved settings for viewport data visualization:
From the Object Info palette of a selected sheet layer viewport, click Data Visualization.
The Viewport Data Visualization dialog box opens.
Click Manage.
The Manage Saved Sets dialog box opens. Select the set to change.
Click to show/hide the parameters.
Click OK to close the Manage Saved Sets dialog box.
~~~~~~~~~~~~~~~~~~~~~~~~~
![]()