Setting site model graphic properties
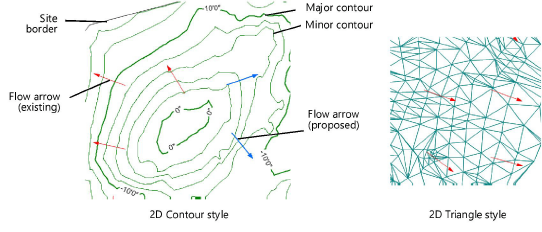
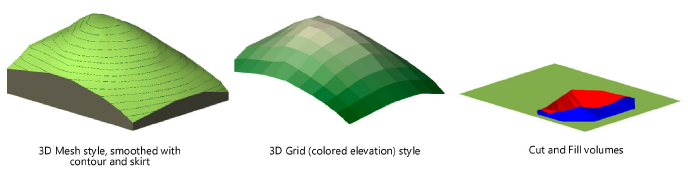
The site model 2D and 3D graphic display properties can be specified to obtain the desired graphic component colors and line styles. In addition, specify the colors for elevation and slope analyses, and for the 3D cut and fill volume representation. These graphic properties can be set when the site model is first created, or changed later by accessing the settings from the Object Info palette.
Changes to the graphic properties are not reflected in the Plan Preview or 3D Preview in the Site Model Settings dialog box.
To set the site model graphic properties:
When creating a new site model, click Graphic Properties from the Site Model Settings dialog box. To edit a current site model, click Site Model Settings from the Object Info palette, double-click the site model, or right-click on a site model and select Edit from the context menu to open the Edit Site Model dialog box. Select Settings and click OK, and then click Graphic Properties from the Site Model Settings dialog box.
The Graphic Properties dialog box opens.
The top portion of the dialog box offers options for saved settings.
|
Parameter |
Description |
|
Saved Settings Options |
See Using saved sets to save and apply saved settings |
On the Site Model tab, the 2D (existing and proposed) and 3D site model display can be completely customized by selecting the class and color for all components, as well as the line type, line thickness, and, for certain components, marker style. Double-click a line to set attributes, or select the item and click Edit.
An Attributes dialog box opens. Select an overall class for each site model component to control its appearance and visibility. The classes present in the drawing are listed; alternatively, create a new class by selecting New, or select the class named <Site Model Class> which places the site model component in the same class as the site model object.
Each attribute (color, line type, line thickness, and marker) can be set to the “By Class” setting. Click Make All Attributes By Class to automatically set all parameters by class. The attributes are then controlled by the class assigned to the component. (See Setting class attributes.)
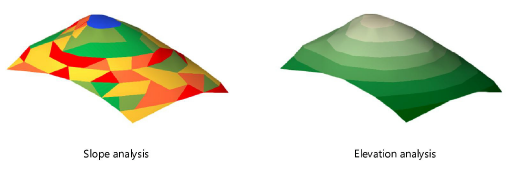
On the Site Analysis tab, set the slope and elevation analysis graphic parameters. A slope analysis shows the slope change of the site model with color ranges indicating the steepest to the shallowest slope. An elevation analysis shows the elevation change of the site model as a gradient of color from the minimum to the maximum elevation.
Click to show/hide the parameters.Click to show/hide the parameters.
|
Parameter |
Description |
|
Slope Colors |
Specify the slope analysis settings |
|
Number of slope categories |
Indicate the number of slope levels to use in the analysis |
|
Category __ maximum slope % |
For each category, indicate the maximum slope percentage and its associated color; slopes below the specified percentage will be colored as specified |
|
Slopes exceeding maximum category |
Slopes above the maximum category’s percentage will receive the selected color |
|
Elevation Colors |
Specify the elevation analysis color settings; a color gradient from the minimum to the maximum elevation is applied to the site model for the elevation analysis |
|
Minimum Elevation Color |
Select the starting color for the lowest elevation |
|
Maximum Elevation Color |
Select the starting color for the highest elevation |
|
2D Cut & Fill Area |
Draws a polygonal representation of the cut and fill over the 2D representation of the site model with the specified colors |
|
Cut Volume Area Color |
Select the color for the volume that is cut from the site model |
|
Fill Volume Area Color |
Select the color for the volume of fill required for the site model |
Click OK to close the Graphic Properties dialog box.
To display a slope analysis, select a display style that shows colored slopes. To display an elevation analysis, select a display style that shows colored elevations.
Create a snapshot of the site model to easily display a slope or elevation analysis along with the site model (see Creating a site model snapshot).
To report slope analysis data in a worksheet, use the “Site Slope Analysis” schedule; see Using preformatted reports.