Creating the site model
Creating a site model from source data
|
Command |
Workspace: Path |
|
Site Model from Source Data |
Architect: AEC > Terrain Landmark: Landmark > Create Site Model |
A site model can either be created from elevation source data or from a boundary (see Creating a site model from a boundary).
After generation, the site model is cached by default so that updating occurs more efficiently; however, large file sizes can result. See Document preferences: Display tab for information on changing the default setting.
To create a site model from source data:
Ensure that valid source data exists. The site model can be created from 3D loci, 3D polygons, stake objects, a point cloud, or by one of the methods described in Site model source data. Verify that there are no problems with the source data with the Validate 3D Data command (see Validating 3D source data).
Select the source data.
Select the command.
If a point cloud is selected as the source data, the Site Model Point Density dialog box opens. Enter the number of 3D locus points to extract, or drag the slider to select a number (see Extracting 3D loci from a point cloud).
The Site Model Settings dialog box opens. Specify the site model parameters.
Site model settings
Click to show/hide the parameters.Click to show/hide the parameters.
|
Parameter |
Description |
|
Name |
Enter a name for the site model object |
|
Keep Source Data |
Retains the original source data when creating the site model with the Site Model from Source Data command, the point cloud if the site model was created directly from a point cloud with the Site Model from Source Data command, or the boundary object for site models created with the Site Model from Boundary command |
|
Saved Settings Options |
See Using saved sets to save and apply saved settings |
|
Plan Preview |
Displays a top/plan preview of the site model |
|
3D Preview |
Displays a 3D preview of the site model |
|
Graphic Properties |
Opens the Graphic Properties dialog box, for Setting site model graphic properties, along with slope and elevation analysis parameters |
Site model settings: General pane
Click to show/hide the parameters.Click to show/hide the parameters.
|
Parameter |
Description |
|
Elevation Settings |
|
|
Maximum Elevation |
Specifies the highest contour elevation to be displayed. No contours are created if the maximum elevation is lower than the minimum elevation, but this can be useful for cut and fill calculations (for example, for pond or backfill volumes). If a site model update will result in contours exceeding the minimum/maximum range, an alert displays, allowing the range to be adjusted. Select Extend Min/Max when Needed to hide the alert and automatically extend the range. |
|
Minimum Elevation |
Specifies the lowest contour elevation to be displayed, defining the bottom of the site model, and determines the Geometry Lowest Z elevation for the site model in the Object Info palette |
|
Extend Min/Max when Needed |
Automatically extends the maximum and/or minimum elevation values, if needed, without displaying an alert for confirmation |
|
Datum Elevation |
Determines the lower elevation boundary for volume calculations |
|
Contour Settings |
|
|
Minor Contour Interval |
Specifies the standard contour line placement interval |
|
Major Contour Multiplier |
Specifies the placement interval of major (heavy) contour lines |
|
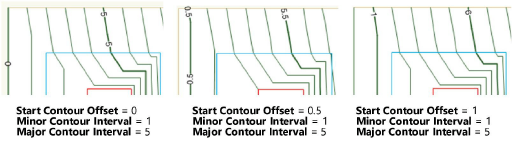
Start Contour Offset |
Controls the starting elevation of the 2D contours
|
|
Segmentation Length |
Specifies the length of straight line segments that make up the curved portions of a contour; a smaller value creates smoother curved contours. A value of 0 (zero) indicates maximum segmentation according to the 2D conversion resolution set in Vectorworks preferences: Edit pane. |
|
Use Site Modifiers on |
|
|
All Layers |
Modifies the proposed site model with modifiers from any layer in the file |
|
Visible Layers Only |
Modifies the proposed site model with modifiers from visible layers only; modifiers on invisible layers do not affect the site model |
|
Same Layer as Site Model only |
Modifies the proposed site model with modifiers that exist only on the site model layer |
|
Opens the Select Layers dialog box, to choose which layers with modifiers can affect the proposed site model. Selected layers display a check mark in the Use column. To create a new design layer, click New Layer; specify the name for the new layer, and click OK. Click OK to return to the Site Model Settings dialog box. The Use Site Modifiers on list displays Custom Set of Layers. |
Site model settings: 2D Display pane
Click to show/hide the parameters.Click to show/hide the parameters.
|
Parameter |
Description |
|
Display |
Select whether to display the existing site model only, proposed site model only, or both existing and proposed site models. The display option can be changed later from the Object Info palette. |
|
Existing Only |
Displays only the existing model, including any site modifiers that apply to the existing site model |
|
Proposed Only |
Displays only the proposed model (the current model changed by any site modifiers that apply to the proposed site model) |
|
Proposed + Existing |
Displays both the proposed model and the existing model; this option is useful when using the site model for a grading plan, with different existing and proposed topographical line styles |
|
Style |
Select a 2D site model display mode |
|
2D Contour |
Draws contour lines |
|
2D Contour (smoothed) |
Smooths contour lines |
|
2D Contour (colored elevations) |
Draws contour lines and colors the elevations for conducting an elevation analysis (elevation analysis parameters are specified by clicking Graphic Properties and selecting the Site Analysis tab) |
|
2D Contour (colored slopes) |
Draws contour lines and colors the slopes within specified ranges for conducting a slope analysis (slope analysis parameters are specified by clicking Graphic Properties and selecting the Site Analysis tab) |
|
2D Triangle |
Represents the surface as triangular facets |
|
2D Triangle (colored slopes) |
For 2D triangle display, colors the slopes within specified angle ranges for conducting a slope analysis (slope analysis parameters are specified by clicking Graphic Properties and selecting the Site Analysis tab) |
|
Draw Site Border |
Draws a closed 2D polygon along the site border (outer edge) of the site model |
|
Show Contour Labels |
Labels 2D contour line elevations |
|
Major Contours |
Displays labels for major contour lines only |
|
Major and Minor Contours |
Displays labels on both major and minor contour lines |
|
Parallel to the topo line |
When labels are selected for display, labels are parallel to the topography lines |
|
Show Flow Arrows |
Adds arrows to show the downward direction for drainage analysis |
|
Flow Arrow Spacing |
Determines the placement of the flow arrows |
|
Scaled to Slope |
Adjusts the size of the flow arrows depending on the underlying terrain; steeper slopes display longer flow arrows, while shorter flow arrows are used for flatter regions. This makes it easier to spot areas with higher drainage flow rates caused by sloping surfaces. |
Site model settings: 3D Display pane
Click to show/hide the parameters.Click to show/hide the parameters.
|
Parameter |
Description |
|
Display |
Select the 3D site model display. The display option can be changed later from the Object Info palette. |
|
No 3D Display |
Displays only the 2D site model, with no 3D component |
|
Existing Only |
Displays the existing 3D site model |
|
Proposed Only |
Displays the proposed 3D site model |
|
Cut and Fill |
Displays the 3D cut and fill volumes. Areas where existing and proposed site models are the same are represented by a flat area. Cut areas display as a depression in the 3D surface, and fill areas display as a raised area in the 3D surface. (Select cut and fill colors by clicking Graphic Properties and selecting the Site Model tab.) |
|
Style |
Select a 3D site model display mode |
|
3D Mesh |
Generates 3D triangles with the Triangulated Irregular Network (TIN) method to form a Vectorworks mesh; this method is the most accurate, as it involves no interpolation. Select Show Skirt to create a valid solid. |
|
3D Mesh (colored elevation) |
Generates 3D triangles to form a mesh, and colors the mesh based on ranges of elevation (elevation analysis parameters are specified by clicking Graphic Properties and selecting the Site Analysis tab) |
|
3D Mesh (colored slope) |
Generates 3D triangles to form a mesh, and colors the slopes within specified ranges for conducting a slope analysis (slope analysis parameters are specified by clicking Graphic Properties and selecting the Site Analysis tab) |
|
3D Grid |
Draws the site model using a regular grid of rectangles to form the surface, spaced by the 3D Grid Spacing value |
|
3D Grid (colored elevation) |
Draws the site model as a regular grid of rectangles, colored based on ranges of elevation |
|
3D Grid (colored slope) |
Draws the site model as a regular grid of rectangles, colored within specified ranges for conducting a slope analysis |
|
3D Vertical Grid |
Represents the site model volume using an array of vertical cells |
|
3D Contour |
Draws the site model using horizontal 3D polygons |
|
3D Extruded Contour |
Creates horizontal solids with a thickness equal to the contour interval; top edges run along contour lines or the site border. This creates a “layer cake” or “chipboard model” effect. |
|
3D Extruded Contours (colored elevation) |
Creates horizontal solids with a thickness equal to the contour interval, colored based on ranges of elevations |
|
Show Skirt (3D Mesh styles) |
Adds solid sides and a bottom to the mesh, creating a valid solid |
|
Show 3D Contour (3D Mesh styles) |
Superimposes a 3D contour on the site model |
|
Mesh Smoothing (3D Mesh styles) |
Smooths the mesh representation when rendered |
|
Crease Angle |
Determines how smooth the mesh appears; enter a higher value for a smoother surface (valid values are 0 to 180) |
|
3D Grid Spacing (3D Grid styles) |
Sets the grid size for 3D display |
|
By Distance |
Defines the grid spacing by X and Y dimension values |
|
By Divisions |
Defines the grid spacing by X and Y divisions; enter the number of grid spaces in the X and Y directions |
|
X/Y |
Specifies either the distance or number of divisions |
|
Approximate Squares |
Automatically calculates the Y value based on the X value, creating an even grid composed of shapes that are as close to square as possible. The X value may change as well based on the calculation. |
|
Use Geoimage Texture |
Textures the site model with the selected georeferenced map image. Due to licensing restrictions, the image displays while working in the file, but it cannot be saved with the file for offline use. Update the geoimage by clicking Update from the site model Object Info palette to download the image again, after saving the file. |
|
Service/Select Service |
Displays the currently selected service; click Select Service to open the Select Service dialog box, and choose a preferred service as described in Geolocating the drawing |
|
Image resolution |
Determines the resolution of the geoimage; select Automatic to obtain an image based on the object’s drawn size and zoom level. Select Custom to enter the number of horizontal pixels for the image source (the vertical pixels are automatically calculated based on aspect ratio). A high Custom resolution could result in performance issues depending on the size and zoom level of the geoimage. |
Site model settings: Components pane
Click to show/hide the parameters.Click to show/hide the parameters.
|
Parameter |
Description |
|
Enable components below surface |
Select the option to create site model components |
|
Components count |
Displays the number of specified components |
|
Edit Components |
Opens the Site Model Components dialog box, to specify the components; see Creating site model components |